Source to Sea: from river to lab

Source to Sea: from river to lab

In collaboration with Teesside University environmental scientists, and with support from Living Uplands, Durham Wildlife Trust aims to assess the source and abundance of plastics in and adjacent to the River Wear as part of the Source to Sea project. This latest blog, by Lisa Baldini from Teesside University, explains more about the sampling and lab processes involved in the project.

Microplastics are small fragments of plastics that are below 5mm in diameter. These include microbeads, fibre from synthetic clothing, and fragments of plastics litter that break down by abrasion during transport in rivers or under the effects of UV radiation from sunlight. Plastic never really goes away; it just gets smaller and smaller. But surely miniscule particles of plastic are nothing to worry about. ‘Out of sight, out of mind’ as the adage goes. Unfortunately, microplastics are commonly mistaken as food by aquatic life, impacting the organisms’ health by accumulating in fatty tissue and organs and entering the food chain. Animals aren’t the only organisms at risk. According to a recent review1, humans are ingesting tens of thousands of microplastic particles per year through their diet. Airborne microplastics further exacerbate the problem.

With rising global awareness of the impact of plastic pollution to our environment and wildlife, an increasing number of studies around the world are seeking to better understand the sources and extent of microplastics pollution at the local to regional level. Whereas, marine studies of ocean microplastics have been ongoing for decades far fewer studies have addressed river plastics.

Rivers connect towns and cities to the oceans and therefore are a main highway network for transferring plastics from us to the sea. Due to their low density, microplastics are easily transported by water. Sources of microplastics include industry, agriculture, litter, and wastewater treatment. Treated wastewater is filtered before being discharged into waterways, but, due to their size, microplastic often pass directly through.

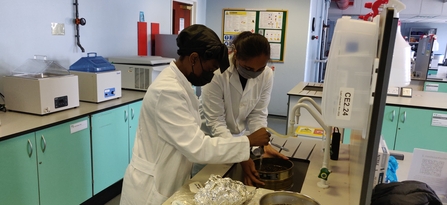
Durham Wildlife Trust and Teesside University are partnering on a pilot study of microplastics in the River Wear. The aim of the study is to determine at what concentrations microplastics are present in the water column as well as the sediment and to observe any spatial trends. This study also aims to promote awareness of environmental microplastics and plastics pollution more generally through engagement with local schools and colleges.

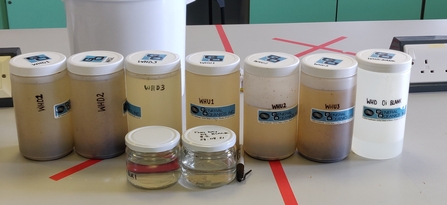
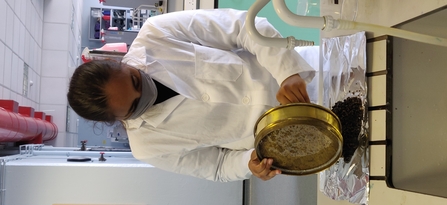
Our pilot study sampled river water and sediment at five different sites along the River Wear:  Wearhead, Frosterley, Bishop Auckland, Durham, and Chester-Le-Street. At each respective site we sampled upstream and downstream of wastewater treatment plants to better understand their contribution to riverine microplastics concentrations. Student groups sampled gravel bar and river bank litter to better understand the impact of littering on our environment.

1Cox, K. D., et al. (2019). "Human Consumption of Microplastics." Environmental Science & Technology 53(12): 7068-7074.

Two people taking water samples in the River Wear

Sampling the River Wear at Wearhead

Stage 1- Sampling

Our study began with visiting our Wearhead site, upstream of an outflow pipe. We used a 100µm microplankton net with a cod-end jar. We measured the depth and width of the river and used a flow metre to calculate flowrate.  At the start of the study, we needed to establish the optimal time period for leaving the net in the water, and so we conducted our sampling three times for different lengths of time (5 minutes, 10 minutes and 20 minutes). We stood at the centre of the river with the net and conducted sampling for the chosen length of time. After the correct length of time passed, we made our way to the riverbank. Using filtered water (water filtered with a metal mesh at 100µm) we sprayed the net into the cod-end jar, to ensure any microplastics were not left behind and caught in the net. We repeated this for the rest of the samples and time-periods. We determined that 20 minutes would be the most appropriate for sampling and therefore the rest of the sampling at the sites were conducted for 20 minutes.

Once we had completed collecting the water samples, we used metal scoops to collect sediment at different points across the riverbed. The sediment samples were wrapped up in tin foil, ready for lab analysis. We repeated this method for the sites downstream of the outflow pipes. We also took blanks of the filtered water throughout the process to determine if the plastic cod end jar or the plastic sprayer were contaminating our samples with additional microplastics. In total we sampled ten different sites, upstream and downstream of outflow pipes located along the Wear.

Stage 2 – Sieving

Once we returned to the lab, we began sieving. We had 4 different sized sieves, >5mm, <5mm >1.1mm, <1.18mm >300µm and <300µm and >100µm. We stacked the sieves in the correct order of size and then tipped the contents of the water sampling jar through the sieves. We then used tweezers and filtered water to separate the contents of the water sample into the appropriate size fractions and decanted into cleaned, pre-weighed and labelled petri dishes for further analysis. We repeated this process for the rest of the water samples, cleaning the sieves with filtered water after every sample and then placed them into the lab ovens for drying at 50oC for 42 hours.

The sediment samples followed a very similar process, the contents of each sample were decanted into the sieves and filtered water and motion (shaking the stack of sieves) separated the sediment into the appropriate size fractions. Each size fraction was sorted and wrapped into labelled tin foil and then placed in the lab ovens for drying at 50oC for 42 hours.

The periodic blanks were filtered through filter paper. We then dried the filter paper in the oven at 50oC overnight before assessing using microscopes. If any microplastics were identified, we would then need to take account of this as part of the study as a potential contaminator and ensure that we were cautious when surrounding microplastics in our samples as they may have entered the study from other sources such as through the filtered water.

Stage 3 – Initial Analysis and Digestion of Water Samples and Density Separation of Sediment.

Once we removed the dried water samples from the oven and noted their dry weight, we looked at them under the microscope. However, we found that it was difficult to determine a difference between plastics and organic matter (such as eggs). As a result, we needed to find a solution. After researching methods, we decided to use 30% hydrogen peroxide (H2O2) heated at 50oc on a hot plate for 3 hours to digest the organic material found within the water samples. However, before going straight into using the H2O2 directly onto our samples Helen, one of the lab technicians brought us different types of plastics and organic material for us to test the hydrogen peroxide on and to establish if the plastics would react poorly to the digestion. We found that there was little damage to the plastics and concluded that it would be safe to use the H2O2 on our samples. We then proceeded to digest all our water samples before analysis.

We then also removed the dried sediment from the oven, and weighed, labelled and cleaned empty beakers before decanting the sediment and calculating the dry weight. In order to identify microplastic presence in the sediment samples we decided to use heavy liquid at a density of 1.7g/ml which is the ideal density to float microplastics. This method will separate the microplastics from the sediment, allowing for ease in isolating the microplastics for further analysis, where the remaining sample will be filtered onto filter paper ready for microscope analysis and FT-IR analysis.

Stage 4 – Analysis and counting of microplastics

Once all the water samples have been digested and the microplastics are separated from the sediment samples, our samples can be thoroughly analysed. We plan to look at each sample under the microscopes and count the number of microplastics we find to be present. From this, we will be able to understand any observable trends in their concentrations within the water as we move further downstream of the source of the Wear. We will also use the FT-IR machine to identify the exact type of microplastics found, so we can attempt to understand which polymer types are found in the Wear and what are the potential plastic sources.